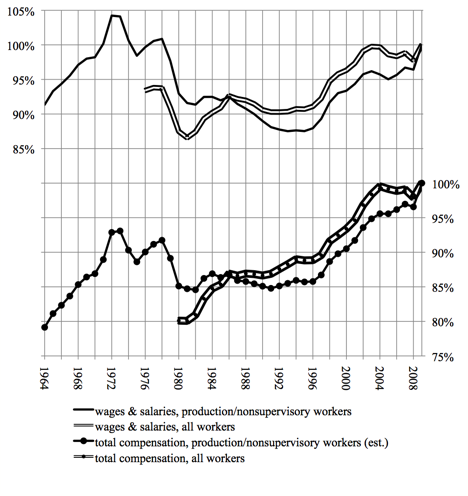
Figure 2a. Compensation Indexes, Private Industry Workers, U.S., (2009 = 100%). Deflated by PCE.

Figure 2b. Compensation Indexes, Private Industry Workers, U.S., (2009 = 100%). Deflated by CPI-W.

Sources [to Figs. 2a and 2b]: Data on average hourly earnings (wages and salaries) of production and nonsupervisory workers come from Table B-8 of the Bureau of Labor Statistics’ Employment Situation release, at bls.gov/webapps/legacy/cesbtab8.htm. Other total compensation data and wage and salary data come from the Bureau’s “Employment Cost Index, Historical Listing, Continuous Occupational and Industry Series, September 1975 – March 2010,” Tables 5 and 9, available at bls.gov/web/eci/ecicois.pdf. I have averaged the quarterly figures for each year. PCE stands for the personal consumption expenditures price index, reported in the National Income and Product Accounts, Table 1.1.4, line 2, which is published by the Bureau of Economic Analysis (www.bea.gov). CPI-W stands for the consumer price index for urban wage earners and clerical workers (published by the Bureau of Labor Statistics and available at www.bls.gov/cpi/). I have averaged the monthly figures for each year.
Return to “Lies, Damned Lies, and Underconsumptionist Statistics”